A method for evaluating quality of cathode materials in Lithium-ion ba…
페이지 정보
본문
A method for evaluating quality of cathode materials in
Lithium-ion batteries through automated electron microscopy
Yong-kyu Ko1*, Dong-hyun Kim1, James Yoon2, Steven Lee2, Ji-hyeon Son2
1충북대학교 물리학과 연구장비개발 Research equipment development, Department of Physics, Chungbuk National University
2(유)한국입자분석연구소 Application LAB, PKoLAB.,LLC
I. Introduction
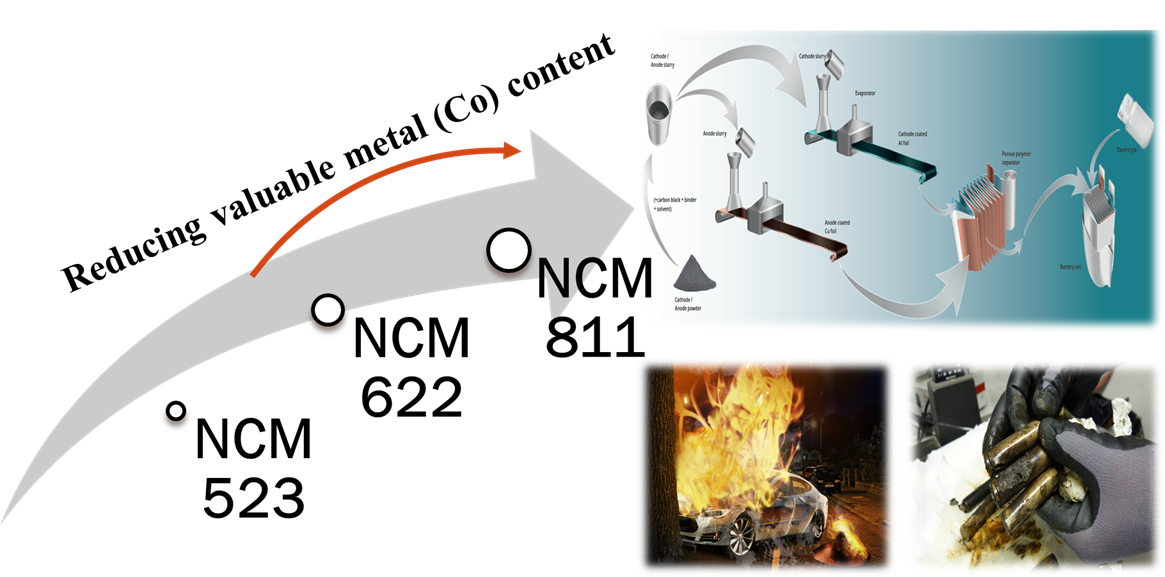
▪ In the case of NCM (Ni, Co, Mn) cathode material most commonly used in industry, it shows different characteristics depending on the composition ratio of Co, Ni and Mn. However, various problems arise as the component content changes. The task of minimizing the occurrence of defects by strengthening thorough quality control as a matter of stability remains an important task.
▪ In general, studies have been conducted with a general electron microscope (SEM-EDS) to observe the ICP or component state that can be analyzed in the PPM unit for whether foreign matter is included, but in this case, only local areas that cannot represent the entire material are observed. This is possible and there are limitations to image analysis in the case of ICP. To compensate for these limitations, an electron microscope (Thermo Fisher Scientific model : Phenom ParticleX battery) suitable for automatically analyzing large-area particles was used. In this study, an efficient analysis method of battery materials is introduced by presenting a new observation method for quality inspection after mass production through the developed analysis method.
II. Experimental details
1. Sample preparation
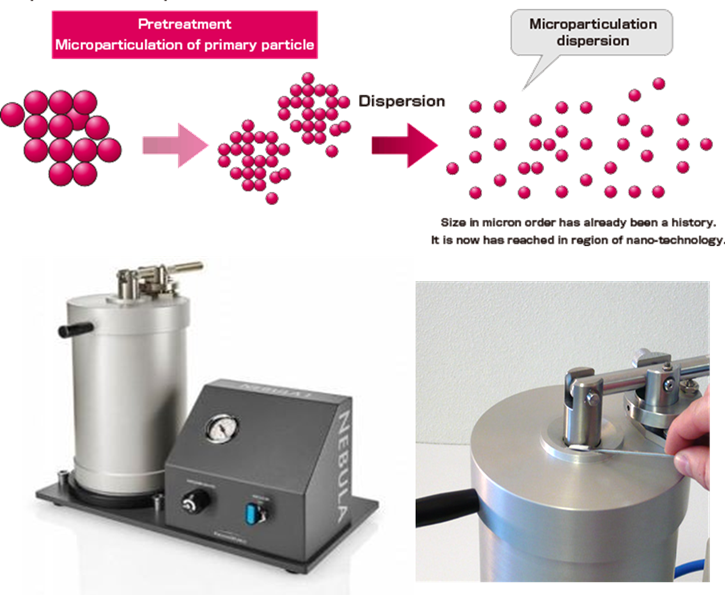
Figure | Particle Dispersion Using Vacuum. (Particle dispenser model : Nebula, Vacuum state: 5x10⁻²torr).
2. Measurement & Workflow
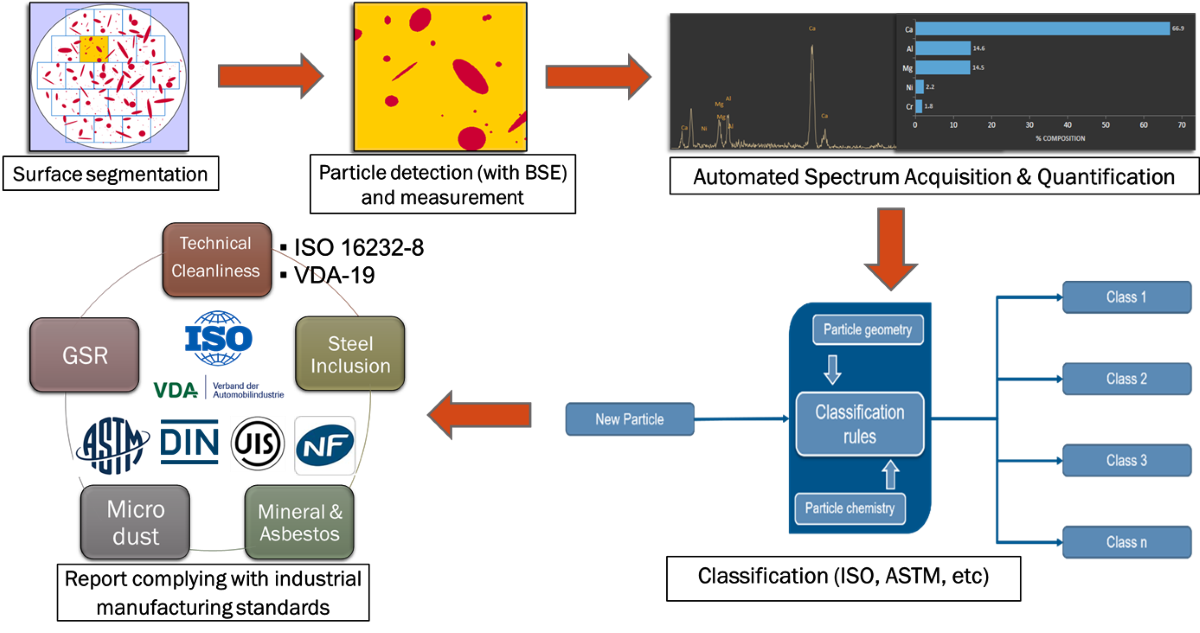
Figure | Automated Feature Analysis Workflow (Montage, Threshold, Classification rules).
3. Analysis conditions
Sample | NCM 811 |
Duration (Running Time)
|
13h 2min
|
Area scanned
|
78.99mm2
|
Number of Stage fields
|
246
|
Particle counts
|
781,314
|
Classification rules
|
ISO 16232
(NCM version)
|
SEM Magnification
|
x300 |
Table | Sample analysis conditions.
III. Results and Discussions
a) Stage map
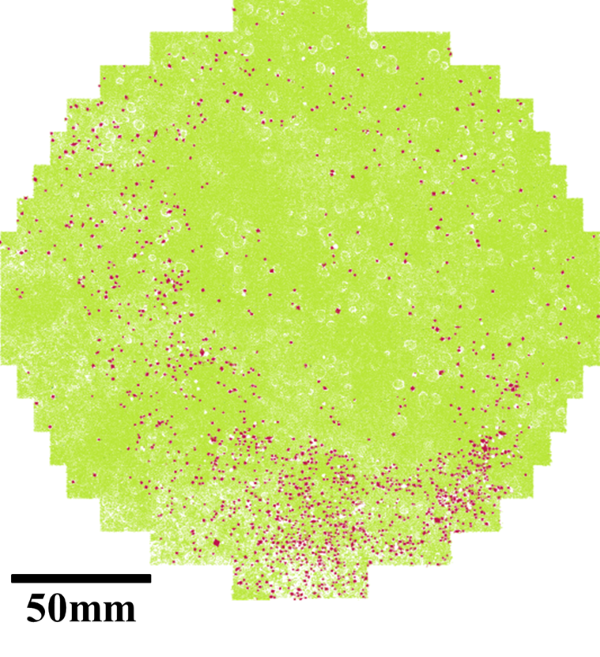
Figure | Whole Picture of NCM powder (Total field : 246, BSE image).
b) Total Particle Results
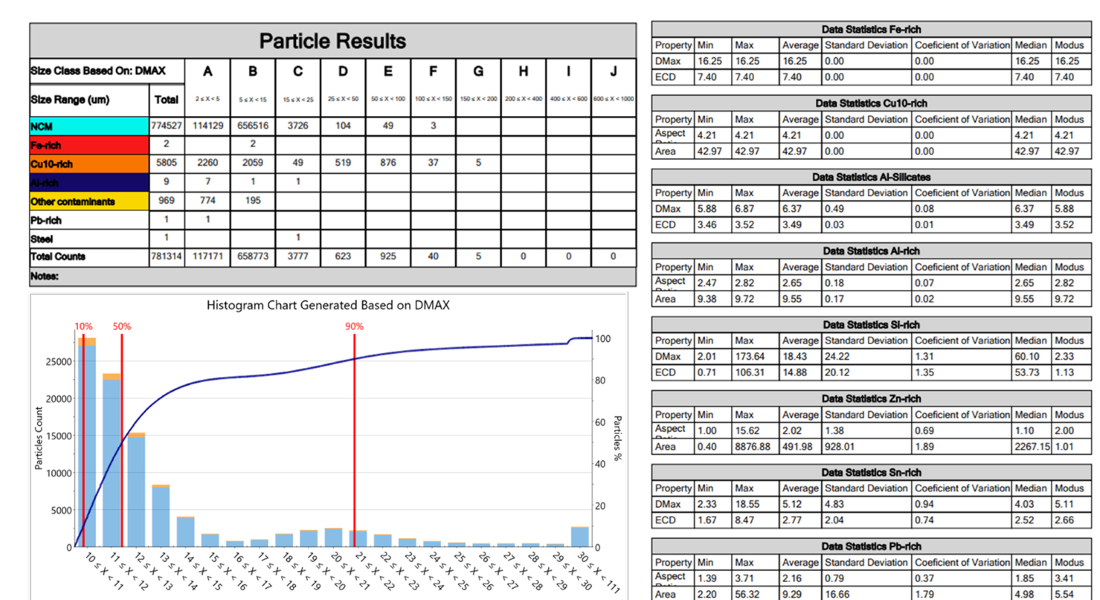
Figure | Particle size distribution and Geometry data by classification (Dmax, ECD, Aspect ratio, Area).
c) Total Chemistry Results
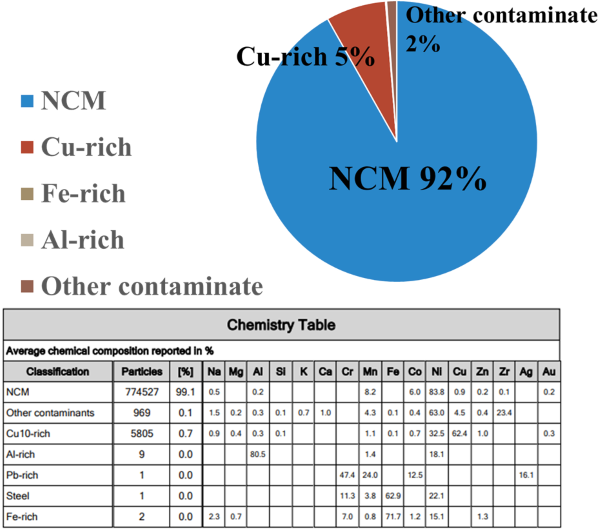
Figure | Total Particle Elements Distribution ratio.
d) Morphology
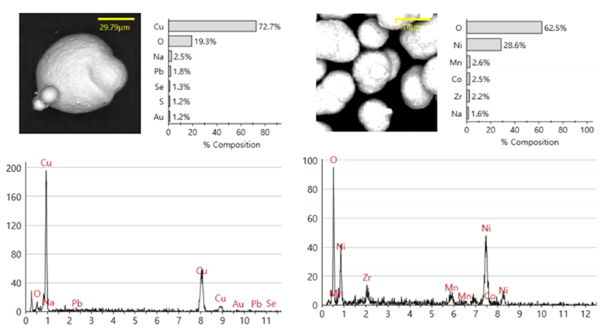
Figure | Morphology of Particle (formation of 781,314 of all particle observed).
e) Ternary phase diagram
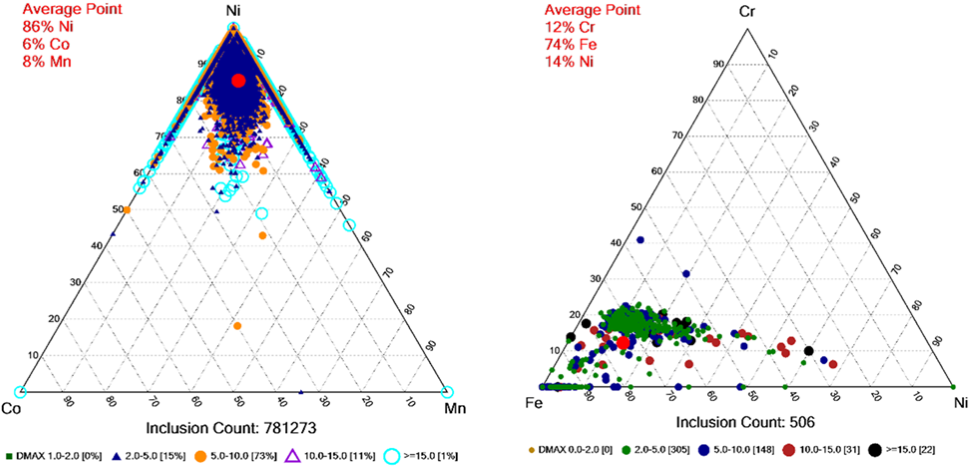
Figure | Ternary phase diagram (Ni, Co, Mn / Cr, Fe, Ni).
f) Plant Monitor

Figure | Plant Monitor (Quality Issue & Event check through plant monitor).
- 이전글A study of the coated area of Alloy metal using automated SEM-EDS 25.08.04
- 다음글배터리 연구와 산업을 위한 통합 솔루션 25.02.06
