A study of the coated area of Alloy metal using automated SEM-EDS
페이지 정보
본문



A study of the coated area of Alloy metal using automated SEM-EDS
Yong-kyu Ko1* , James Yoon1, Ji-hyeon Son1, Steven Lee1 1Application LAB, PKoLAB.LLC
E-Mail : kyk@pkolab.com
I. Introduction
▪ The international standard ASTM recommends about 10 micron alloy coating. As the last surface treatment process in the root industry, it is an indispensable process, and coating treatment plays an important role in overcoming the physical, chemical, and emotional limitations that a product can realize.
However, in order to observe the coating state of these mass-produced materials of various scales, research has generally been conducted with portable XRF or SEM-EDS, but in this case, only a local area of the material can be observed, and portable XRF has limitations in quantitative analysis.
▪If only local areas are observed, it is difficult to determine the exact quality of mass-produced materials. To compensate for this limitation, an electron microscope (ThermoFisherScientific : Axia ChemiSEM) suitable for automatic large-area analysis was used, and at the same time, large-area mapping was performed to observe the coating state over a large area.
II. Method
1. Sample preparation & Measurement
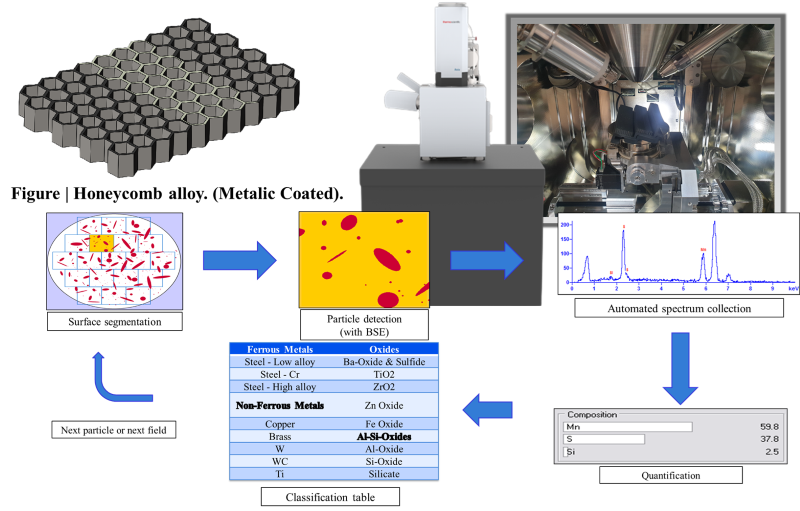
Figure | Honeycomb alloy samples with different processes.
2. Analysis conditions
Sample1
|
Sample2
| |
Running Time
|
1 h 10 mins
|
1 h 14 mins
|
Total Fields
|
272
|
308
|
Classification Scheme
|
Quality Control(Ni)
|
Quality Control(Cr)
|
Features Detected (ea)
|
355
|
430
|
Field Area (sq. µm)
|
3.15E+06
|
3.15E+06
|
Total Analyzed Area (sq. µm)
|
7.07E+078
|
8.02E+08
|
Table | Analysis conditions.
III. Results
a) Large Area Image (Sample1)
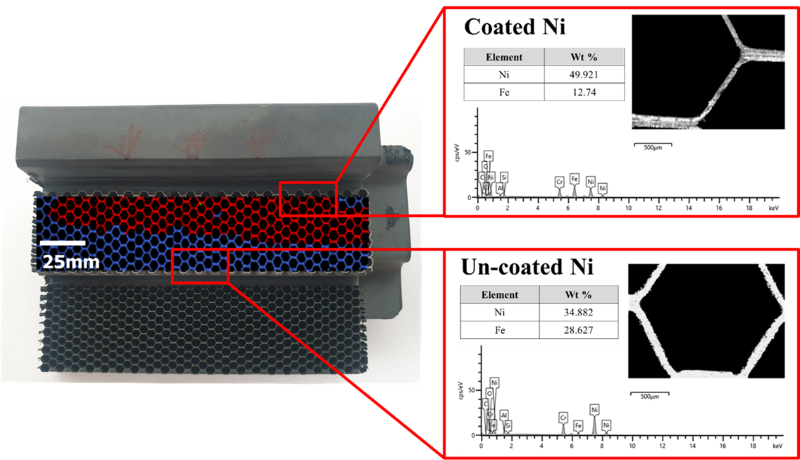
Figure | Overlaid Large area mapping image. (Measured area: 100mm x 3mm)
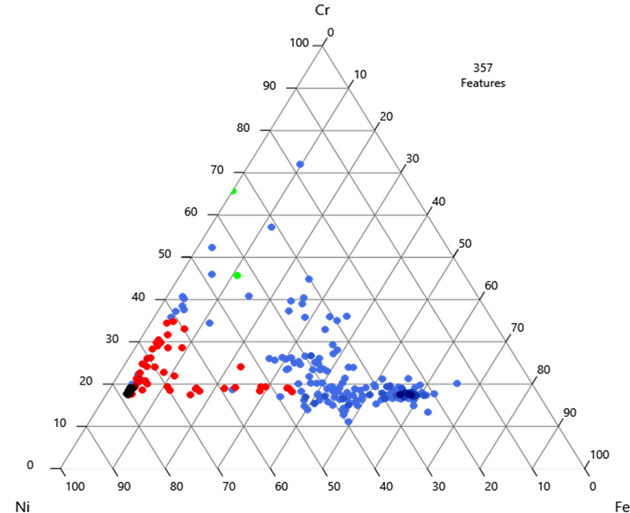
Figure | Thenory diagram. (Ni-Fe-Cr).
Class | Features | % Total Features | Class Features Area (sq. μm) | % Features Area |
Ni Alloy (Success) | 165 | 46.22 | 5.09E+07 | 44.7 |
Fe Alloy (Failure) | 190 | 53.22 | 6.3E+07 | 55.27 |
Table | Features distribution.
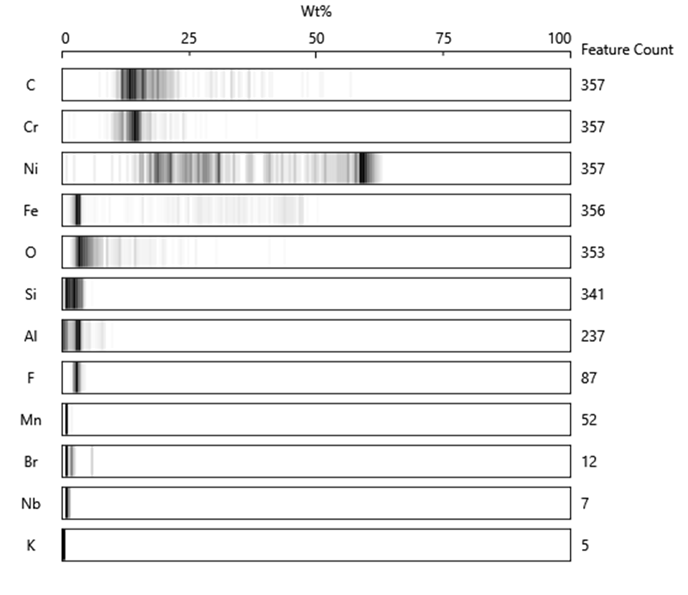
Figure | Elemental composition.
▪ It can be seen that the coated surface is classified as successful when Ni is composed of 48% or more, and only 46% of the total area is coated.
b) Large Area Image (Sample2)
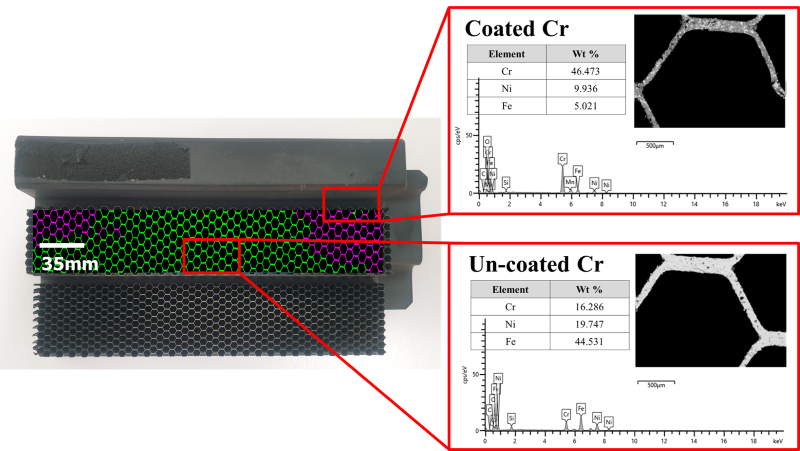
Figure | Overlaid Large area mapping image. (Measured area: 100mm x 3mm)
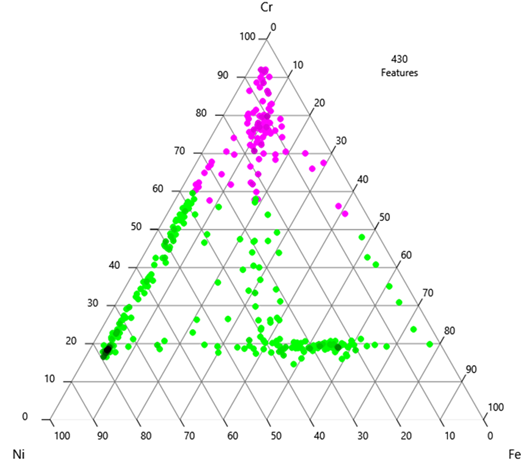
Figure | Thenory diagram. (Ni-Fe-Cr)
Class | Features | % Total Features | Class Features Area (sq. μm) | % Features Area |
Cr Alloy (Success) | 115 | 26.74 | 2.92E+07 | 24.51 |
Ni-Fe Alloy (Failure) | 315 | 73.26 | 8.98E+07 | 75.49 |
Table | Features distribution.
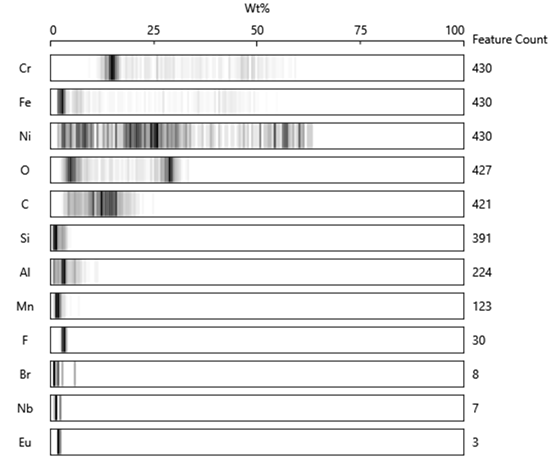
Figure | Elemental composition.
▪It can be seen that the coated surface is classified as successful when Cr is composed of 46% or more, and only 26% of the total area is coated.
IV. Conclusions
▪ In this study, an efficient analysis method is introduced by presenting a new observation method for quality inspection after mass production through the developed analysis method. Evaluating and managing systematically is a long-standing task for coating companies.
▪ By measuring the surfaces of different alloys by automated large-area mapping, the distribution of components in the coating state and the degree of coating can be quantified. In this way, the cause of the defect can be identified.
